Excellent
"If you rented a boat from us, we don't need to introduce ourselves. If you book with us for the first time, you will soon get to know us." 🙂 Some feedback about us...
Renting a boat in Ionian islands & discovering the Greek Coasts? We will find the perfect boat for you. Wide selection – Get your offer!
Read more information about yacht charter in the Ionian Sea on the following tabs: About Ionian Sea, Ionian Sea weather. Get some inspiration from the Ionian islands itineraries tab and start planning your next sailing itinerary.
Small boats (under a certain horsepower or length), electric boats, crewed yacht charters and gulet charters may not require a license. Larger boats or those with more powerful engines need a skipper’s license. Before you confirm your sailing trip to Ionian islands, please send us a copy and we will check it for you. You need to have the original copies with you on-board, so don’t forget to take them.
To sail in Greece, one of the following qualifications is necessary: • ICC (International Certificate of Competence), International, with valid Navigational and VHF licenses, Prerequisites: RYA “Day Skipper Course” or complete the ICC Assessment form to prove competence from previous experience.• IPC (International Proficiency Certificate), America, Prerequisites: ASA 104 or US Sailing “Bareboat Cruising Course” OR: • NauticEd SLC (International Sailing License and Credentials), International, • UK – RYA Day Skipper practical, • USA – US Sailing “Bareboat Cruising Course”, ASA “104 Bareboat Cruising Course” or above, • Germany – “Sportbootführerschein See“ or above, • Belgium – Algemeen Stuurbrevet/ Brevet de conduite général, • France – LE PERMIS PLAISANCE
If you do not have a skipper license, it is also possible to rent a boat with a skipper
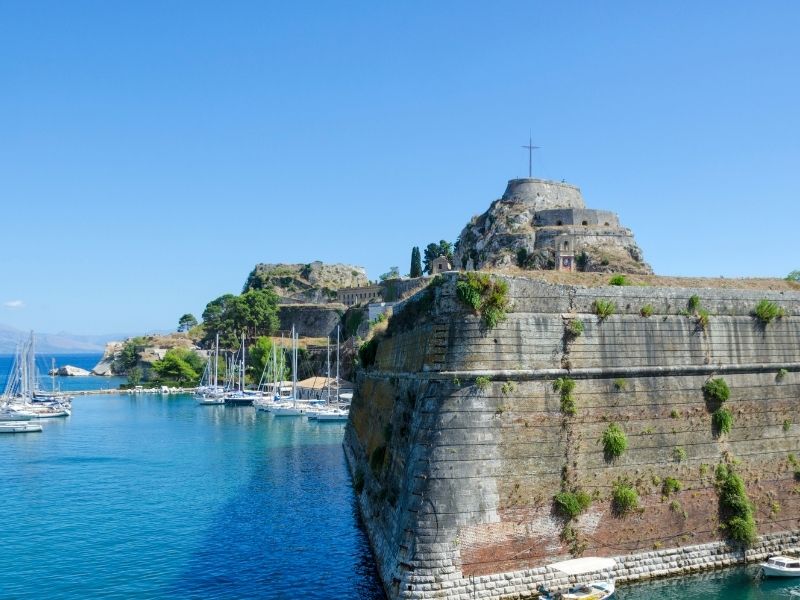
This is the main port of Corfu and is located in the capital city, Corfu Town (Kerkyra). It is a busy commercial port with connections to the mainland of Greece and various international destinations. Cruise ships also often dock at this port. yacht hire Corfu Lat. 39.630383145208874, Long. 19.902143077724542
Gouvia is a marina located on the east coast of Corfu, near Corfu Town. It is one of the largest marinas in Greece, catering to private yachts and boats. Lat. 39.64787081121765, Long. 19.854260228182103 rent a yacht in Corfu
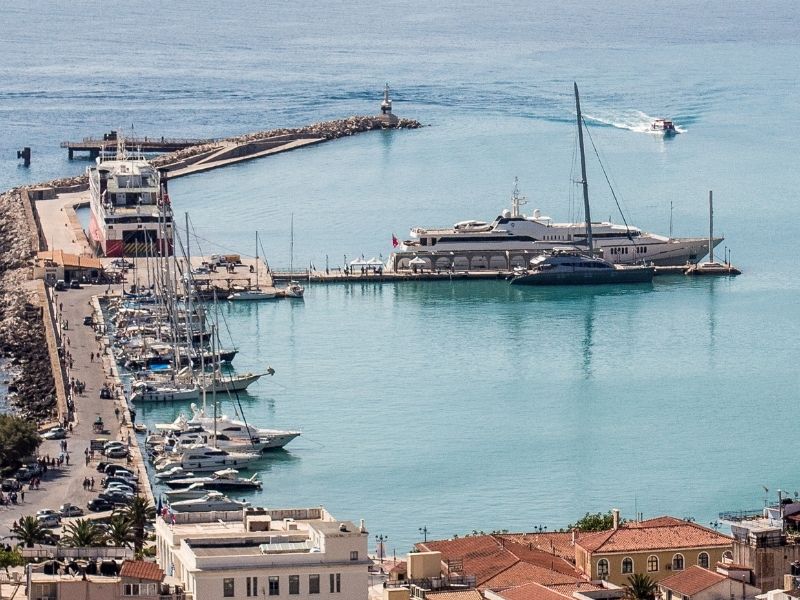
This is the main port of Zakynthos, situated in the capital town of Zakynthos Town (also known as Zante Town). It is a busy port with ferry connections to the mainland of Greece and other Ionian Islands. Lat. 37.78420741224608 Long. 20.89984970937242
Located on the northeast coast of Zakynthos, Agios Nikolaos is a small port that offers boat trips and excursions to the nearby Blue Caves and Shipwreck Beach (Navagio Beach). Lat. 37.90735108451621 Long. 20.70734888207006 boat rental Zakynthos
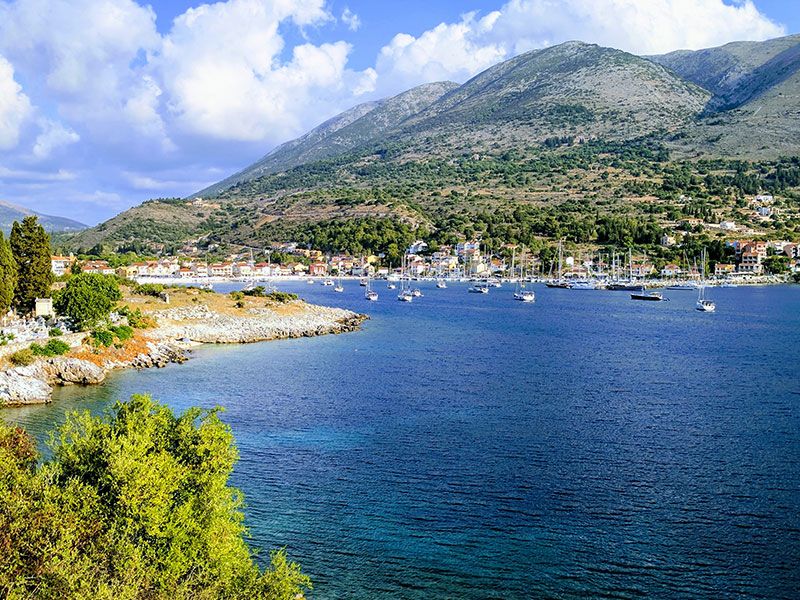
Kefalonia, one of the largest Ionian Islands in Greece, has several ports that play a key role in connecting the island with mainland Greece and neighboring islands.
Argostoli is the capital and main port of Kefalonia. The port serves as a transportation hub with ferry connections to other Ionian Islands and the mainland, including ferries from and to Kyllini on the western coast of the Peloponnese. Argostoli boat hire Lat. 38.18066186284726 Long. 20.495689741540037
Poros is a port town located on the southeastern coast of Kefalonia. Ferries operate from Poros to the neighboring island of Kythira and the mainland port of Kyllini. Lat. 38.149024427460546 Long.20.78119483015008 yacht charter Kefalonia
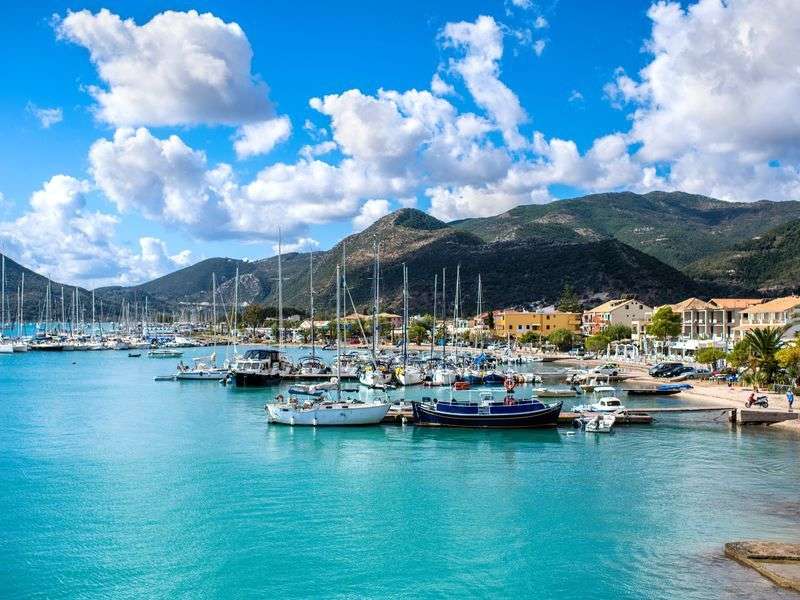
Lefkas is the main port on the island, offering ferry connections to the mainland and other nearby islands. Lat. 38.83079134025834 Long. 20.711346610672823
Nydri, located on the east coast of Lefkada, has a port that serves boat excursions and ferries to nearby islands, including Meganisi, Ithaca, and Kefalonia. Nidri boat rental Lat. 38.70650778213564 Long. 20.711183911966476
Vasiliki, on the southern coast, is known for its windsurfing and sailing conditions. The port caters to passenger boats, ferries, and private yachts. boat rental Vasiliki Lat. 38.62761964499518 Long. 20.604479552534087 boat hire Lefkada
Patras is a major city in the northern part of the Peloponnese, and it has one of the largest and busiest ports in Greece. The port of Patras located in the suburb of Antheia, close to the city center connects the Peloponnese with Italy through ferry services, and it serves as a gateway to the Ionian Islands. Lat. 38.22718403469247 Long. 1.717576649397476
Kyllini is a coastal town in the northwestern part of the Peloponnese. It is the third-largest passenger port in Greece, with 1.5 million passengers per year. Ferries from Kyllini connect the Peloponnese with the islands of Zakynthos and Kefalonia. Lat. 37.93724537166721, Long. 21.14834322751584
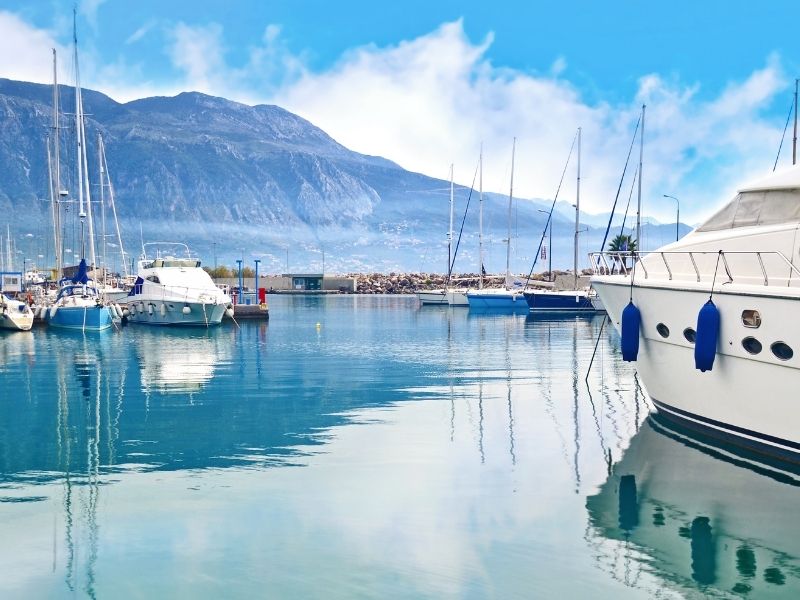
Gytheio port is located in the southern Peloponnese and is well-known as a lively and charming harbor town., and it has a port that serves local maritime traffic. Lat. 36.75946131253711 Long. 22.569335520521847 yacht charter Peloponnese
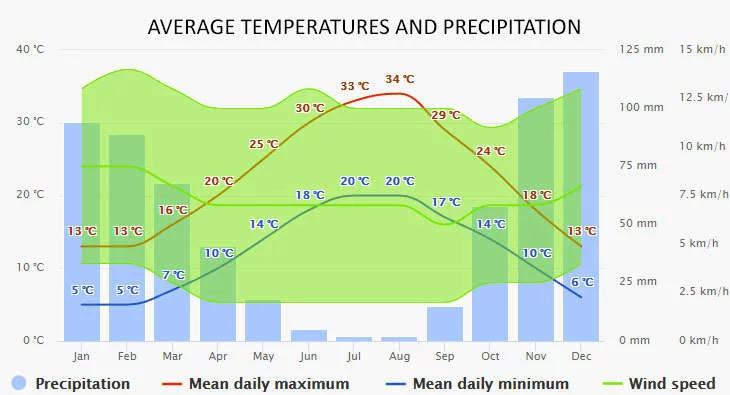
The climate diagrams are based on 30 years of hourly weather model simulations. They give good indications of typical climate patterns and expected conditions (temperature, precipitation, sunshine, and wind). The “mean daily maximum” (solid red line) shows the maximum temperature of an average day for every month for Ionian Sea. Likewise, the “mean daily minimum” (solid blue line) shows the average minimum temperature.
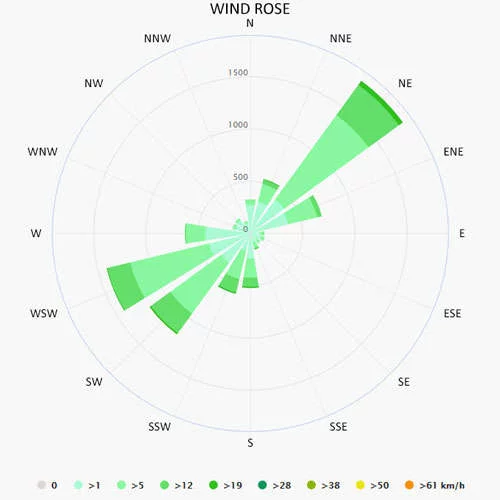
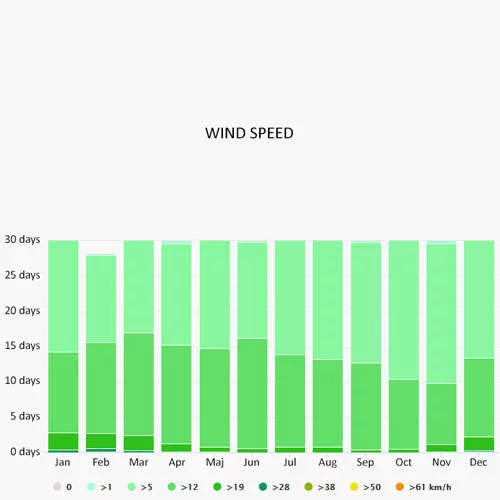
The wind rose for Ionian Sea shows how many hours per year the wind blows from the indicated direction. The diagram for Ionian Sea shows the days per month, during which the wind reaches a certain speed.
Excellent
"If you rented a boat from us, we don't need to introduce ourselves. If you book with us for the first time, you will soon get to know us." 🙂 Some feedback about us...
Change destination X
Distance
Date from
Duration
You must choose a "Date from" before specifying the duration!
Flexibility
Cabins
Berths
to
Types
Sevice Types
Length
to
Sort by:
13 %
Greece, Korfu (Sailing yacht)
from 621 €/day
15 %
Greece, Korfu (Catamaran)
from 364 €/day
20 %
Greece, Preveza (Sailing yacht)
from 371 €/day
10 % + 10 %
Greece, Paleros (Catamaran)
from 583 €/day
Greece, Pylos (Sailing yacht)
from 300 €/day
50 %
Greece, Lefkas (Sailing yacht)
from 229 €/day
30 %
Greece, Lefkas (Catamaran)
from 469 €/day
20 %
Greece, Lefkas (Sailing yacht)
from 142 €/day
15 %
Greece, Lefkas (Sailing yacht)
from 279 €/day
5 %
Greece, Lefkas (Sailing yacht)
from 452 €/day